Image Details
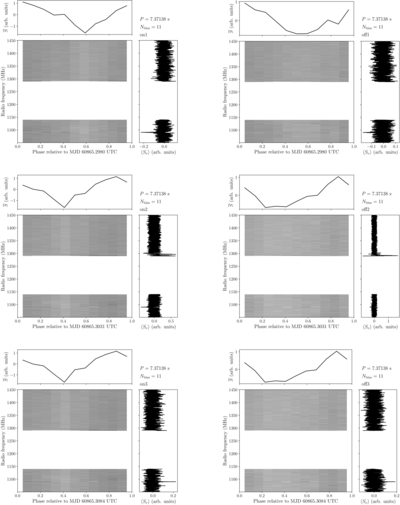
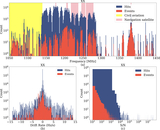
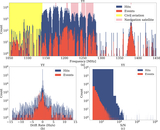
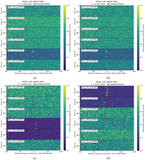
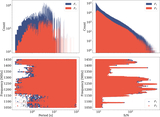
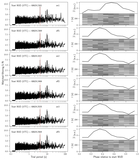
Caption: Figure 17.
Phase-resolved spectrum of Lalande 21185 at P = 7.37138 s for the three on-source (left column) and off-source (right column) scans. For each panel, the top left subplot is the frequency-averaged profile, the bottom left subplot is the phase-resolved spectrum, and the bottom right subplot is the profile spectrum.
Other Images in This Article
Show More
Copyright and Terms & Conditions
© 2026. The Author(s). Published by the American Astronomical Society.
Copyright ©
2026 Astronomy Image Explorer. All Rights Reserved.