Image Details
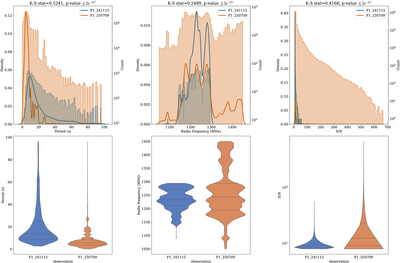
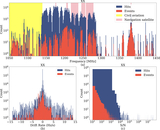
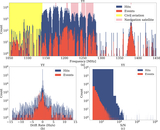
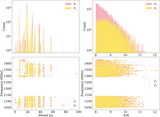
Caption: Figure 15.
Statistics for the periods (first column), frequencies (second column), and the signal-to-noise ratios (third column) of these candidates of the observations on 2024 November 15 (blue) and 2025 July 9 (orange). The top row shows the statistical distributions while the bottom row gives the violin plots.
Other Images in This Article
Show More
Copyright and Terms & Conditions
© 2026. The Author(s). Published by the American Astronomical Society.
Copyright ©
2026 Astronomy Image Explorer. All Rights Reserved.