Image Details
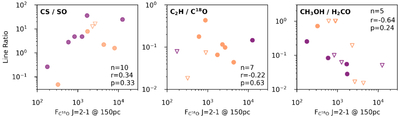
Caption: Figure 8.
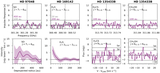
Disk-integrated line flux ratios compared to the C18O J = 2–1 line. The purple points are the disks within this survey and the orange points are from the literature (as described and listed in Appendices B and C; Table 6). The triangles denote 3σ upper limits. Numbers in the bottom right of each panel show the number of detections and the resulting Pearson correlation coefficient (r) and p-value for each set of variables, where n denotes the number of data points considered in the correlation test.
Other Images in This Article

Show More
Copyright and Terms & Conditions
© 2026. The Author(s). Published by the American Astronomical Society.
Copyright ©
2026 Astronomy Image Explorer. All Rights Reserved.