Image Details
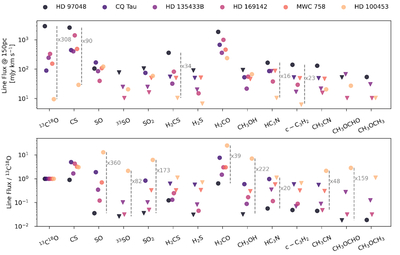
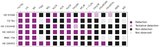
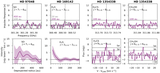
Caption: Figure 1.
Top: disk-integrated fluxes for the molecules detected in at least one disk across the sample. Bottom: disk-integrated fluxes relative to the 13C18O J = 3–2 line flux for each disk. The disks are listed in order of decreasing dust mass, as in Table 1. Both detections and tentative detections are shown as circles, whereas the triangles are 3σ upper limits, as listed in Table 2. The dashed lines and numbers note the factor difference between the highest flux detection and lowest detection or upper limit where this difference is greater than 1 order of magnitude. For most of the lines, the ±1σ error bars are smaller than the plot markers.
Other Images in This Article

Show More
Copyright and Terms & Conditions
© 2026. The Author(s). Published by the American Astronomical Society.