Image Details
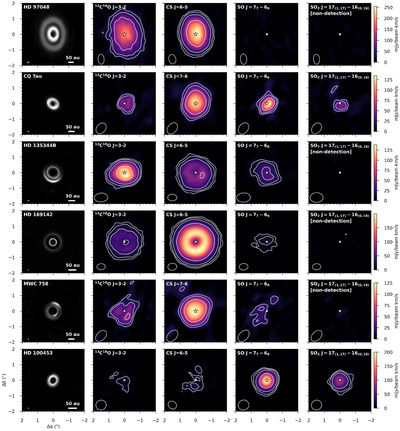
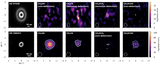
Caption: Figure 2.
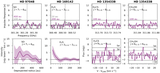
Integrated intensity maps of the dust continuum emission (taken from P. Cazzoletti et al. 2018a; R. Dong et al. 2018; S. Pérez et al. 2019; C. Pinte et al. 2019; M. G. Ubeira Gabellini et al. 2019; G. P. Rosotti et al. 2020) and molecular-line emissions of 13C18O, CS, SO, and SO2 are presented. Each row of line maps shares a common color bar scale, and the contours indicate the 3σ, 5σ, 10σ, and 30σ levels of the integrated line emission. A scale bar in the leftmost column represents 50 au, and the position of the central star is marked with a star symbol. Nondetections and tentative detections are noted. Note that the CS J = 7–6 data are taken from R. Teague et al. (2025).
Other Images in This Article

Show More
Copyright and Terms & Conditions
© 2026. The Author(s). Published by the American Astronomical Society.