Image Details
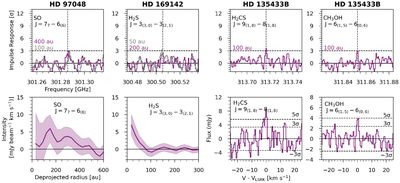
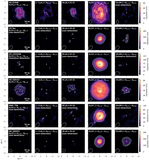
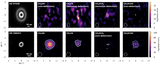
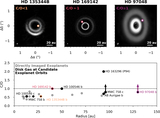
Caption: Figure 10.
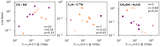
Top: matched-filter responses confirming the tentatively detected molecules in the survey. Each column signifies a different disk as noted in the plot titles, and the radial size of the Keplerian mask(s) is stated in each panel, where purple is a detection and gray a nondetection. Bottom: GoFish radial profiles or disk-integrated fluxes generated over a 0–100 au area.
Other Images in This Article

Show More
Copyright and Terms & Conditions
© 2026. The Author(s). Published by the American Astronomical Society.
Copyright ©
2026 Astronomy Image Explorer. All Rights Reserved.