Image Details
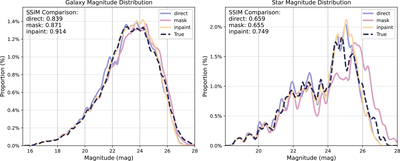
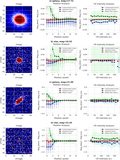
Caption: Figure 7.
Comparative analysis of number count performance. Magnitude distributions for stars (right) and galaxies (left) using three CR mitigation approaches: “direct” (representing uncorrected photometry ignoring CRs, light blue solid line), “mask” (denoting photometry excluding masked CR-contaminated pixels, pink solid line), and “inpaint” (indicating photometry after CR inpainting, orange solid line). The dark blue dashed line represents the true magnitude distribution from the input catalog. SSIM values quantifying the agreement between each mitigation method and this true distribution are displayed in the upper-left corner of each panel.
Other Images in This Article


Copyright and Terms & Conditions
© 2025. The Author(s). Published by the American Astronomical Society.