Image Details
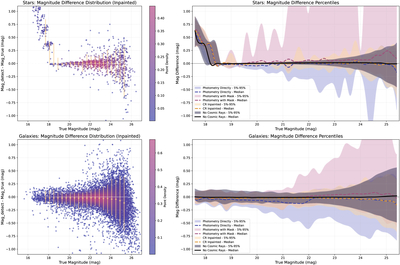
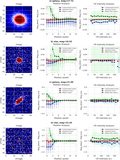
Caption: Figure 6.
Photometric error distributions for CR affected stars (top) and galaxies (bottom) from full frames. The left column displays scatter plots of magnitude difference (measured—true magnitude) vs. true magnitude for CR-contaminated sources processed with inpainting techniques. Points are color-mapped by local density (blue: sparse, red: dense) with overlaid binned statistics (5th/50th/95th percentiles) shown as gold error bars. The right column compares percentile trends across four CR handling methods: traditional photometry without correction (blue), masked photometry (pink), inpainted photometry (orange), and CR-free reference data (black). Shaded bands represent 5th–95th percentile ranges and lines indicate medians.
Other Images in This Article

Copyright and Terms & Conditions
© 2025. The Author(s). Published by the American Astronomical Society.