Image Details
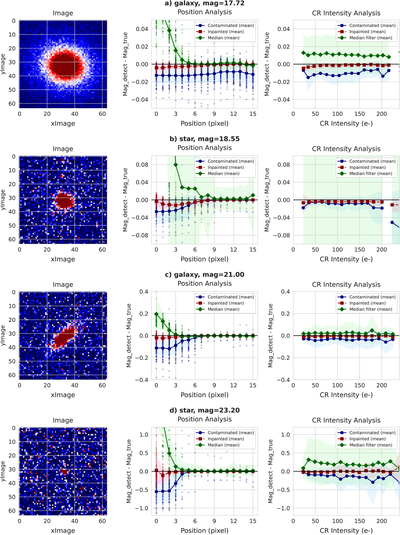
Caption: Figure 5.
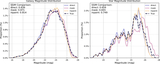
Photometric accuracy between CR inpainting methods for individual sources. Left: original images of sources. Middle: magnitude differences vs. CR distances (pixels) for CR-contaminated images (blue), corrected images (red) and median-filter corrected images (green). Solid lines show binned means, shaded regions indicate ±1 standard deviation, and raw data points display individual measurements. Right: magnitude differences vs. CR intensity for the same three cases. Vertical scales adapt to magnitude ranges.
Other Images in This Article


Copyright and Terms & Conditions
© 2025. The Author(s). Published by the American Astronomical Society.
Copyright ©
2026 Astronomy Image Explorer. All Rights Reserved.