Image Details
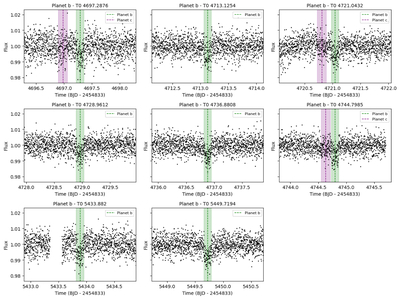
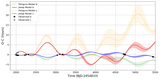
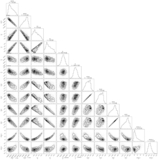
Caption: Figure 8.
Individual transit time predictions for K2-19b from the jnkepler model, with a window of 1 day before and after mid-transit. Predicted times for planet b (green) and planet c (purple) are shown by the dashed lines, and the shaded regions represent the respective planet b transit predictions in relative proximity to predictions for planet c transits.
Other Images in This Article
Copyright and Terms & Conditions
© 2025. The Author(s). Published by the American Astronomical Society.
Copyright ©
2025 Astronomy Image Explorer. All Rights Reserved.