Image Details
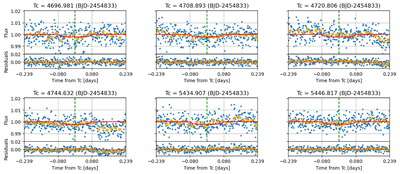
Caption: Figure 2.
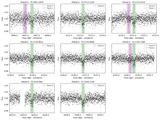
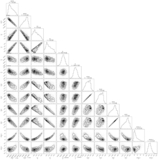
Same as Figure 1 but for K2-19 c. The green dashed lines show the predicted transit times based on the MAP model described in Section 2.2. The transits themselves are lost in the noise, and we do not attempt to fit them.
Other Images in This Article
Copyright and Terms & Conditions
© 2025. The Author(s). Published by the American Astronomical Society.
Copyright ©
2025 Astronomy Image Explorer. All Rights Reserved.