Image Details
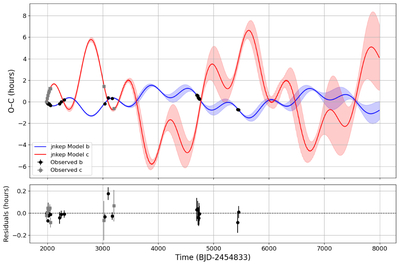
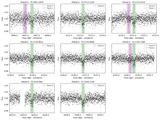
Caption: Figure 3.
The black points represent observed transit times for planet b and the gray points represent observed transit times for planet c. The solid lines represent the model derived in this work, including the TESS transit data.
Other Images in This Article
Copyright and Terms & Conditions
© 2025. The Author(s). Published by the American Astronomical Society.
Copyright ©
2025 Astronomy Image Explorer. All Rights Reserved.