Image Details
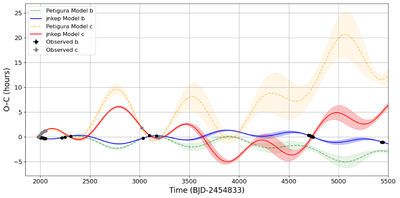
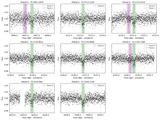
Caption: Figure 4.
Black and gray points are observed TTVs for planet b and c respectively. The dashed lines show the E. A. Petigura et al. (2020) predicted times conditioned on data up to t ≈ 3200 days; the solid lines show our model that includes all the times shown. The models agree up to t ≈ 3200 days, but diverge beyond that point.
Other Images in This Article
Copyright and Terms & Conditions
© 2025. The Author(s). Published by the American Astronomical Society.
Copyright ©
2025 Astronomy Image Explorer. All Rights Reserved.