Image Details
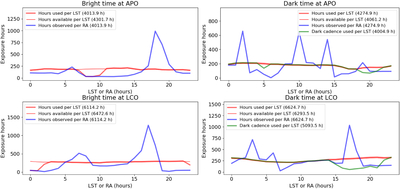
Caption: Figure 9.
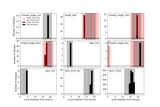
Availability and allocation of time in zeta-0. The left panels show bright time (as defined in the text) and the right panels show dark time. The top panels show APO and the bottom panels show LCO. The available time as a function of LST is the thin red line. The planned use of time as a function of LST based on the results is shown as the thick red line. The distribution of time spent at specific R.A.s are shown as the blue line. For dark time, the green line indicates the amount of time spent on dark cadence fields. The Galactic plane near 18hr is apparent, particularly in bright time, but also in dark time at LCO, and the RM fields are apparent in dark time.
Other Images in This Article


Show More
Copyright and Terms & Conditions
© 2025. The Author(s). Published by the American Astronomical Society.