Image Details
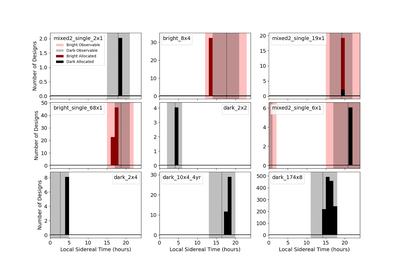
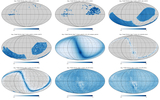
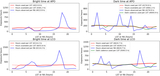
Caption: Figure 10.
Observability and allocation of time for nine individual fields and cadences (the cadences they were assigned). The mixed cadences consist of two dark time designs followed by bright time designs. In each panel, the dotted vertical line corresponds to the R.A. of the field (i.e., the LST at which it transits). The pink and gray bands show the allowable LSTs in bright and dark time, which differ because of the different airmass limits. The dark time cadences only allow dark time, so only gray bands appear. The red and black histograms show the actual allocated distribution of LST resources in bright and dark time, respectively. In some cases dark time will be assigned even for bright time designs (e.g., for the four of the designs in the mixed2_single_6x1 cadence).
Other Images in This Article
Show More
Copyright and Terms & Conditions
© 2025. The Author(s). Published by the American Astronomical Society.