Image Details
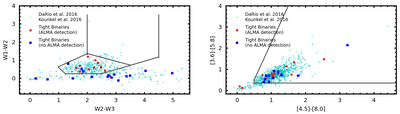
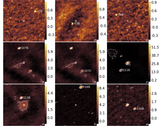
Caption: Figure 6.
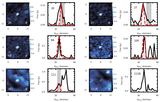
Infrared color–color diagrams using photometry from WISE (left) or Spitzer (right). In the left panel the polygon indicates the region containing class II sources, while the extensions upwards demarcate the region with class I sources (W. J. Fischer et al. 2016). In the right panel the black lines delineate sources with a significant infrared excess (R. A. Gutermuth et al. 2008). Inner disk excess emission is most evident in the longer-wavelength observations of WISE and Spitzer, in particular beyond ∼5 μm (W2 – W3, [3.6] – [5.8], [4.5] – [8.0]).
Other Images in This Article
Copyright and Terms & Conditions
© 2025. The Author(s). Published by the American Astronomical Society.
Copyright ©
2026 Astronomy Image Explorer. All Rights Reserved.