Image Details
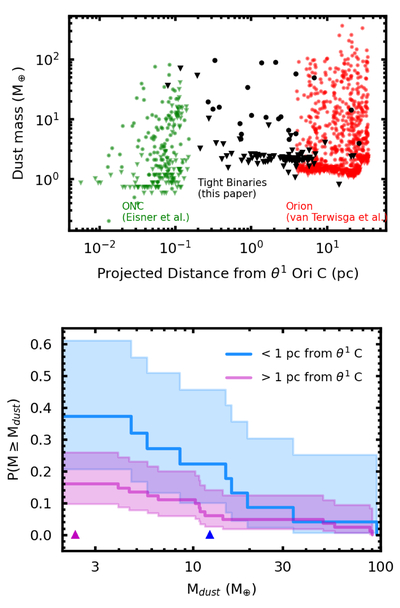
Caption: Figure 8.
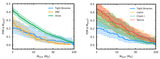
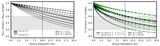
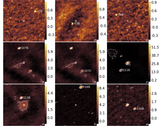
Top: dust mass as a function of projected distance from θ1 Ori C for the tight binaries studied here (black points), ONC targets (green points, J. A. Eisner et al. 2018), and targets from across the Orion cloud (red points, S. E. van Terwisga et al. 2022). The vast majority of the tight binaries fall beyond the region within 0.1 pc that J. A. Eisner et al. (2018) identified as being affected by external photoevaporation. Bottom: disk dust mass distributions comparing tight binaries within 1 pc of θ1 Ori C and more distant sources. Sources close to θ1 Ori C show slightly higher masses, most likely due to the diminished sensitivity in a region with higher background emission; triangles indicate average upper limits for the corresponding samples.
Other Images in This Article
Copyright and Terms & Conditions
© 2025. The Author(s). Published by the American Astronomical Society.