Image Details
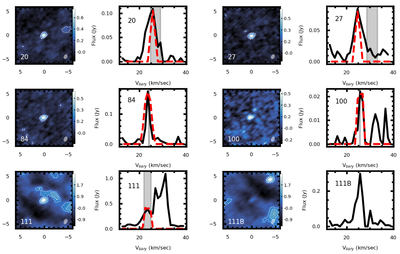
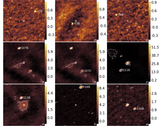
Caption: Figure 4.
HCO+ detections, including moment 0 maps (in units of Jy bm−1 km s−1) and spectra (in the barycentric reference frame and in units of Jy). Cloud contamination is present in some of the spectra at vbary ∼ 30 km s−1. Dotted contours in the moment 0 maps are at 3σ, 5σ, 10σ, and 20σ. Gray bands indicate the ±1σ ranges for the stellar velocities as measured in optical spectra by M. Kounkel et al. (2019). Red dashed lines show model disk emission for comparison, generated using parametric models as described in Appendix B.
Other Images in This Article
Copyright and Terms & Conditions
© 2025. The Author(s). Published by the American Astronomical Society.
Copyright ©
2026 Astronomy Image Explorer. All Rights Reserved.