Image Details
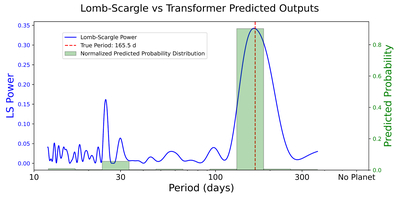
Caption: Figure 28.
This figure shows a comparison between the Lomb–Scargle periodogram and the model-predicted probability distribution for a representative Sun–planet system. Both methods identify the planetary period to be approximately 165 days. A secondary peak, likely associated with stellar rotation near 25 days, is visible in the periodogram power spectrum. The machine learning model outputs a discrete probability distribution across 11 classes, representing 10 period bins and one class for the no planet scenario. In contrast, the periodogram provides a continuous power distribution over periods ranging from 12 to 365 days. The x-axis is plotted on a logarithmic scale to better visualize the broad range of periods. For comparison purposes, the period bin corresponding to the highest periodogram power (165 days in this example) is taken as the periodogram-predicted bin, as described in Section 6.5.
Other Images in This Article
Show More
Copyright and Terms & Conditions
© 2025. The Author(s). Published by the American Astronomical Society.