Image Details
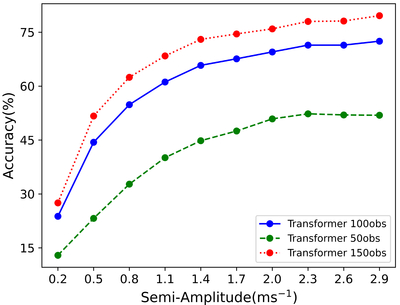
Caption: Figure 27.
This figure compares the model’s classification accuracy for the monthly separated ordered validation data set M (see Sections 4.2, 6.3) across scenarios with 50, 100, and 150 observations. Accuracy consistently improves across all semi-amplitudes as the number of observations per sample increases, reflecting the expected effect of a larger observation count.
Other Images in This Article
Show More
Copyright and Terms & Conditions
© 2025. The Author(s). Published by the American Astronomical Society.
Copyright ©
2025 Astronomy Image Explorer. All Rights Reserved.