Image Details
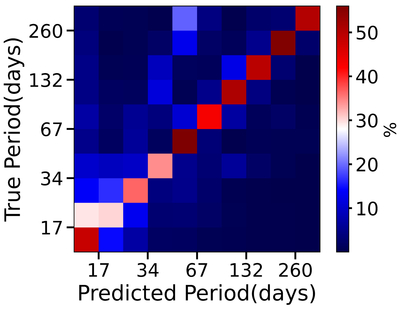
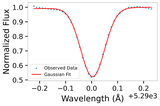
Caption: Figure 26.
This figure presents the confusion matrix for period predictions on the ordered, monthly separated validation data set M, after fine-tuning, normalized along the “true period” axis. The distribution closely resembles that of Figure 18, with the influence of solar rotation remaining apparent for periods shorter than 35 days.
Other Images in This Article
Show More
Copyright and Terms & Conditions
© 2025. The Author(s). Published by the American Astronomical Society.
Copyright ©
2025 Astronomy Image Explorer. All Rights Reserved.