Image Details
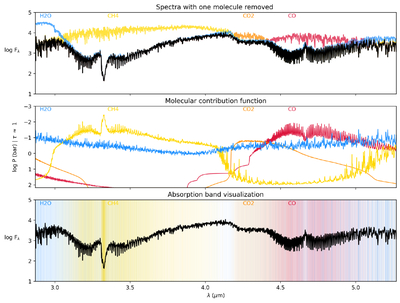
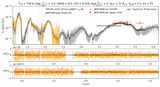
Caption: Figure 3.
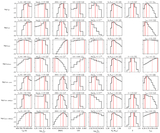
(Upper) Template spectra used for computing the CCF shown with perturbations from removing individual molecules in the radiative transfer calculation. (Middle) Molecular contribution functions calculated using picaso.jdi.get_contribution. The curve shows the pressure layer where the optical depth per species is approximately unity. (Lower) A visualization where the absorption features are shown per species using colored banding with variable opacity to denote deeper absorption.
Other Images in This Article
Copyright and Terms & Conditions
© 2025. The Author(s). Published by the American Astronomical Society.
Copyright ©
2025 Astronomy Image Explorer. All Rights Reserved.