Image Details
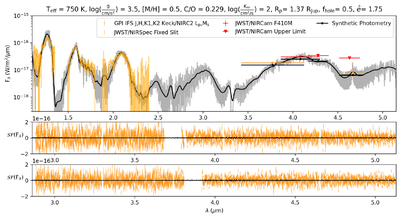
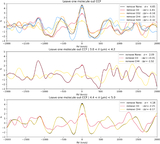
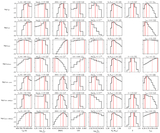
Caption: Figure 6.
Best-fit model spectra from the first iteration of computing likelihood with no subgrid interpolation or NIRSpec covariance shown in black at R = 100 and in gray at R = 2700 in the upper panel and continuum-subtracted in black at R = 2700 in the two lower panels. (Upper) GPI IFS spectra in bands J, H, K1, and K2, KECK/NIRC2 Lp and Ms photometry, and JWST/NIRCam F410M, F430M, and F460M photometry in red. (Middle) NIRSpec continuum-normalized spectra from slit A1 and slit A2 (lower).
Other Images in This Article
Copyright and Terms & Conditions
© 2025. The Author(s). Published by the American Astronomical Society.
Copyright ©
2025 Astronomy Image Explorer. All Rights Reserved.