Image Details
Caption: Figure 1.
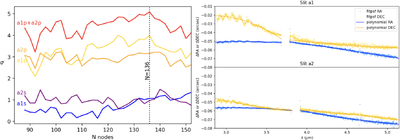
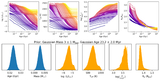
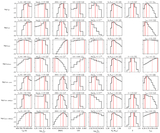
Diagnostic plots generated during data reduction. (Left) Detection significance as a function of the node spacing hyperparameter for each individual data sequence showcasing the robustness of the detection, as well as the optimal node spacing. (Right) Best-fit coordinates in slit A1 (top) and slit A2 (bottom) and corresponding regularized polynomial fit as a function of wavelength computed during the centroiding/coordinate correction step.
Other Images in This Article
Copyright and Terms & Conditions
© 2025. The Author(s). Published by the American Astronomical Society.
Copyright ©
2025 Astronomy Image Explorer. All Rights Reserved.