Image Details
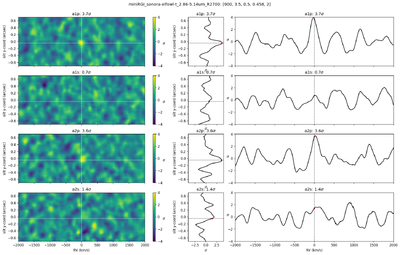
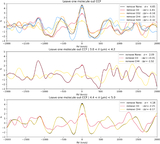
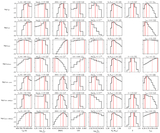
Caption: Figure 11.
Cross-correlation function calculated on individual data sets, showing detections in slits A1 and A2 individually. (Left) 2D CCF detection maps in IFU Y–RV phase space, (middle) CCF slice through RV = 0 km s−1, and (right) CCF slice through IFU Y = −0﹩\mathop{.}\limits^{\unicode{x02033}}﹩04, the expected position of the planet.
Other Images in This Article
Copyright and Terms & Conditions
© 2025. The Author(s). Published by the American Astronomical Society.
Copyright ©
2025 Astronomy Image Explorer. All Rights Reserved.