Image Details
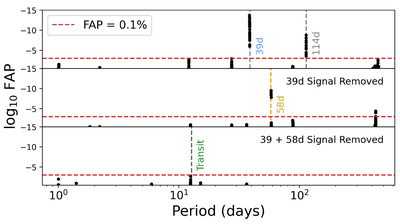
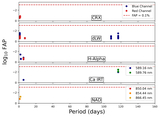
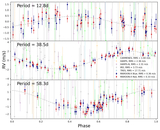
Caption: Figure 7.
The results from our ℓ1 periodogram analysis of the RVs of GJ 12. The figure shows the identified significant periods of the top 1% of noise models (in terms of cross-validation scores) for our RV data and identifies the FAPs that they are present in the data. We include a red dashed line at FAP values of 0.1% for reference. We highlight and label the 39, 58, and 114 day signals mentioned in the text, as well as the period of the transiting planet. Top panel: our results with no unpenalized periods. Middle panel: our results with the 39 day period unpenalized. Bottom panel: our results with both the 39 and 58 day periods unpenalized.
Other Images in This Article
Show More
Copyright and Terms & Conditions
© 2025. The Author(s). Published by the American Astronomical Society.