Image Details
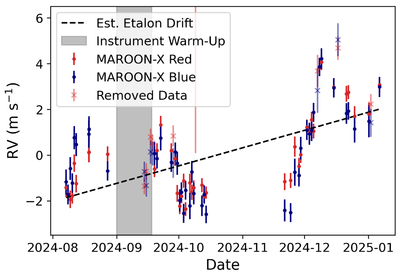
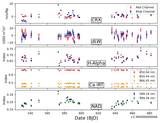
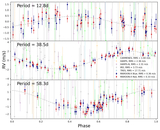
Caption: Figure 1.
The MAROON-X RVs described in this paper. The RVs that are not used in the final analysis are shown in lighter colors and indicated with “x” markers. The grayed-out region represents the time during the September 1–18 temperature anomaly. We also include a dashed line indicative of the etalon drift slope as calculated for the calibrator star HD 3651 (see Section 4.1 for more details). We have not modified the data in any way for the purpose of producing this figure, and have not subtracted out any offsets or slopes.
Other Images in This Article
Show More
Copyright and Terms & Conditions
© 2025. The Author(s). Published by the American Astronomical Society.
Copyright ©
2025 Astronomy Image Explorer. All Rights Reserved.