Image Details
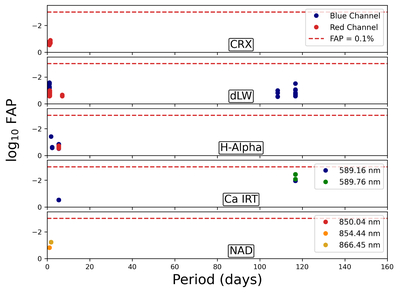
Caption: Figure 6.
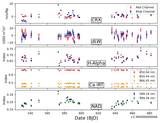
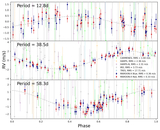
The ℓ1 periodogram analysis of the GJ 12 MAROON-X activity indicators. The figure shows the identified significant periods of the top 1% of noise models (in terms of cross-validation scores) for our RV data and identifies their false-alarm probabilities (FAPs) in the data. We include a red dashed line to indicate the 0.1% FAP level. From the top to bottom panel, these are: the chromatic index in the red and blue channels, the differential line width in the both channels, the hydrogen alpha line index in both channels, the three calcium infrared triplet line indices (8500.4 Å, 8544.4 Å, and 8664.5 Å), and the two sodium doublet line indices (5891.6 Å and 5897.6 Å). In general, we see that none of the activity indicators have any signals with an FAP < 0.1%, meaning that we cannot identify the stellar activity period from this data set.
Other Images in This Article
Show More
Copyright and Terms & Conditions
© 2025. The Author(s). Published by the American Astronomical Society.