Image Details
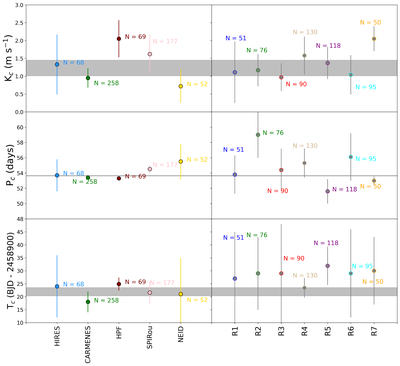
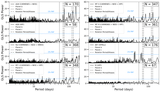
Caption: Figure 9.
The posterior values for Kc, Pc, and Tc, and their uncertainties, are shown from top to bottom. Fits divided by instrument on the left, and divided by observing region on the right. A gray bar highlights the posterior value of our best all-data fit and its 1σ confidence interval.
Other Images in This Article
Show More
Copyright and Terms & Conditions
© 2025. The Author(s). Published by the American Astronomical Society.
Copyright ©
2025 Astronomy Image Explorer. All Rights Reserved.