Image Details
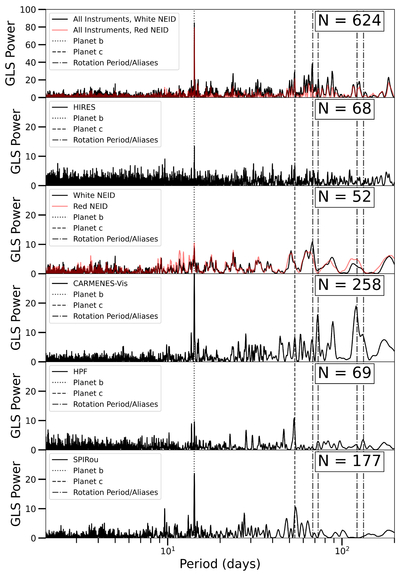
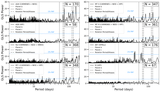
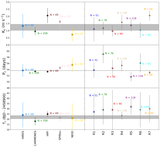
Caption: Figure 2.
GLS periodograms of GJ 251 RV data. Top: The entire data set that was used in the analysis of the system, with instrumental offsets applied (taken from Table 4). Bottom: Periodograms on the data from individual instruments. Pre-/postsplits for HIRES, HPF, and NEID have been combined after offset correction. Instruments are ordered from bluest to reddest. NEID and all-data periodograms include a red line, indicating the result when red NEID RVs are utilized. Signals of interest highlighted are at 14, 54, 68, 73, 120, and 130 days.
Other Images in This Article
Show More
Copyright and Terms & Conditions
© 2025. The Author(s). Published by the American Astronomical Society.
Copyright ©
2025 Astronomy Image Explorer. All Rights Reserved.