Image Details
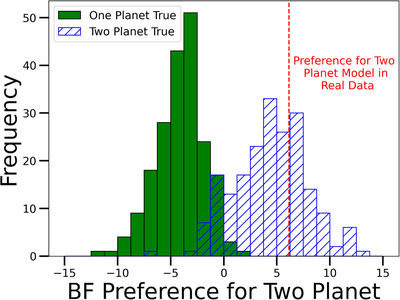
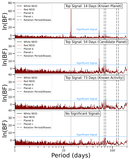
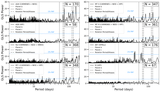
Caption: Figure 10.
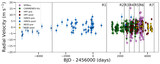
Two histograms highlighting the results of model comparisons on simulated data sets. After generating 200 fake one-planet and 200 fake two-planet data sets, we performed nested sampling fits for one- and two-planet models, and computed the difference in BF. When the fake data include only one injected planet, it is very rare that a two-planet model is preferred. On the other hand, when the generated data include two injected planets, a two-planet model is often preferred, with the BF in the real data falling on the center of this distribution.
Other Images in This Article
Show More
Copyright and Terms & Conditions
© 2025. The Author(s). Published by the American Astronomical Society.
Copyright ©
2025 Astronomy Image Explorer. All Rights Reserved.