Image Details
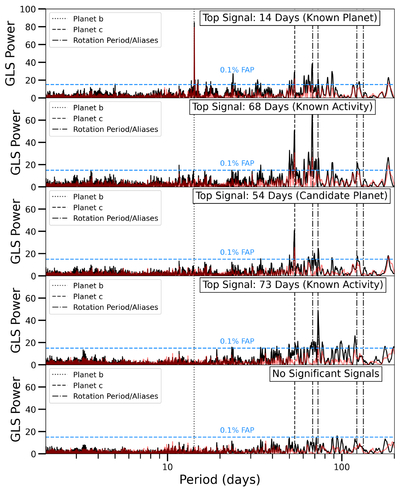
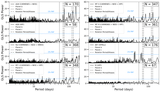
Caption: Figure 3.
GLS periodograms of GJ 251 RV data as we sequentially remove the most prominent signals. Black plots include white NEID data, while red plots include red NEID data. GJ 251 b is the most significant by far at first, but its subtraction reveals several other prominent signals. Eventually, subtracting signals only adds noise to the periodograms, so we cease our analysis. False alarm probabilities are estimated using methods in P. A. Sturrock & J. D. Scargle (2010). Signals of interest highlighted are at 14, 54, 68, 73, 120, and 130 days.
Other Images in This Article
Show More
Copyright and Terms & Conditions
© 2025. The Author(s). Published by the American Astronomical Society.
Copyright ©
2025 Astronomy Image Explorer. All Rights Reserved.