Image Details
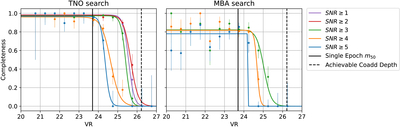
Caption: Figure 6.
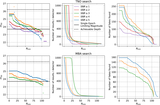
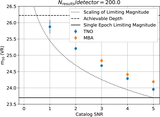
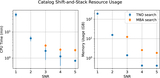
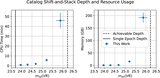
The fraction of synthetic objects recovered as a function of their magnitude for the TNO and MBA searches. Dots represent the detection fraction in bins of size 0.5 mag, and error bars represent the asymmetric uncertainty in the estimated fraction using the Wilson score interval. Two reference magnitudes are visualized as black solid and dashed vertical lines. The solid black line visualizes the estimated single-epoch m50 = 23.7. The dashed black line represents the theoretical achievable depth by coadding all of the images, and it is equal to ﹩{m}_{50}^{{\rm{coadd}}}=26.2﹩.
Other Images in This Article
Show More
Copyright and Terms & Conditions
© 2025. The Author(s). Published by the American Astronomical Society.
Copyright ©
2026 Astronomy Image Explorer. All Rights Reserved.