Image Details
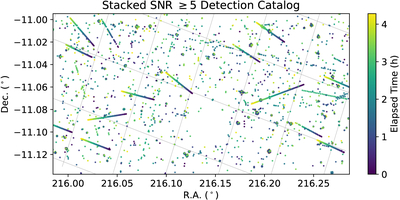
Caption: Figure 5.
A visualization of the sky locations of a stacked detection catalog derived from a 4 hr sequence of DECam images with a grid of constant ecliptic latitude/longitude overlaid. Detections at a single epoch represent the on-sky location of a putative source on a difference image. Detections are accumulated across all 104 epochs and plotted jointly in this visualization. Moving objects appear as lines in this stacked visualization. Stationary variable sources as well as difference imaging artifacts appear as clusters and isolated points. Holes or voids in this visualization represent regions of the CCDs that were masked out due to the presence of bright stars and the resulting saturation of portions of the detector.
Other Images in This Article
Show More
Copyright and Terms & Conditions
© 2025. The Author(s). Published by the American Astronomical Society.