Image Details
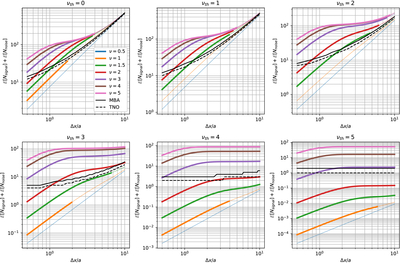
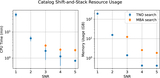
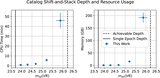
Caption: Figure 2.
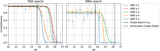
The expected number of detection counts in a bin of size Δx for objects of different SNR ν found in catalogs of different SNR thresholds νth. Thick (thin) colored lines approximately indicate when the expected number of signal detections will be larger (less) than the expected number of noise detections, i.e., when ﹩{\mathbb{E}}[{N}_{{\rm{signal}}}]/{\mathbb{E}}[{N}_{{\rm{noise}}}]\gt 1﹩ (or <1), indicating when a single object of the given SNR ν is distinguishable from noise in a stack of the detection catalog that corresponds to the given object’s trajectory. Black solid (dashed) lines indicate values of ﹩{N}_{{\rm{\min }}}﹩ that produce a false-positive rate of ϵ = 100/Nstacks in an example MBA (TNO) search covering Ω = 162 arcmin2 with a = 1″ seeing and a Δt = 4 hr time baseline. Colored lines lying in regions of the parameter space ﹩{N}_{\min }={\mathbb{E}}[{N}_{\mathrm{signal}}]+{\mathbb{E}}[{N}_{\mathrm{noise}}]﹩ and Δx above (below) the black lines represent when objects of the given SNR ν are (un)likely to appear in the results of a search before producing 100 results corresponding to stacks of noise detections.
Other Images in This Article
Show More
Copyright and Terms & Conditions
© 2025. The Author(s). Published by the American Astronomical Society.