Image Details
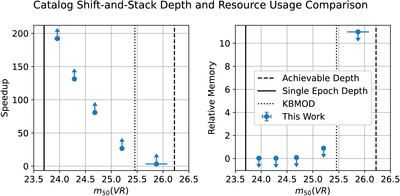
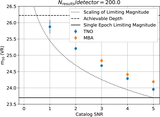
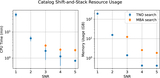
Caption: Figure 14.
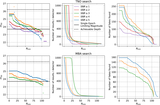
The relative total CPU time (speedup) and memory usage of our algorithm when compared to an image-based shift-and-stack search. The black solid line visualizes the single-epoch m50 = 23.7, while the dashed black line visualizes the theoretical maximum ﹩{m}_{50}^{{\rm{coadd}}}=26.2﹩ that could be achieved through optimal coaddition. The dotted black line visualizes the ﹩{m}_{50}^{{\rm{KBMOD}}}=25.47﹩ depth achieved in an image-based shift-and-stack approach, utilizing the KBMOD software.
Other Images in This Article
Show More
Copyright and Terms & Conditions
© 2025. The Author(s). Published by the American Astronomical Society.
Copyright ©
2025 Astronomy Image Explorer. All Rights Reserved.