Image Details
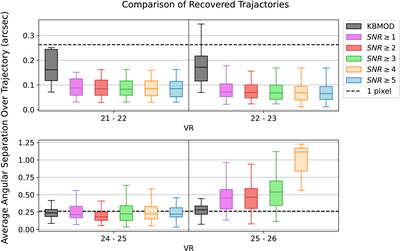
Caption: Figure 13.
Distributions of average separation between the ground truth and recovered trajectories of synthetic objects found via the image-based shift-and-stack (KBMOD) and catalog-based shift-and-stack (this work) over SNR = 1–5. Separation is computed as the great-circle distance between the two trajectories at a given point in time, and an average separation is computed over the 4 hr observing period. Distributions are represented as box-and-whisker plots that visualize (excluding outliers) the minimum, maximum, and 25th, 50th (median), and 75th percentiles of the distribution. A black dashed line visualizes an angular separation that corresponds to a fiducial pixel scale for DECam ps = 0﹩\mathop{.}\limits^{\unicode{x02033}}﹩263 pixel−1.
Other Images in This Article
Show More
Copyright and Terms & Conditions
© 2025. The Author(s). Published by the American Astronomical Society.