Image Details

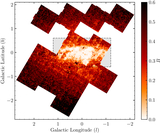
Caption: Figure 1.
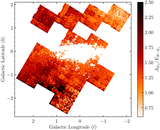
The fields observed by the UKIRT team during the 2017 and 2018 seasons. The 2019 season contains the same regions except for the top row of orange grids. Each square represents a grouping of the four CCDs on WFCAM. The black area shows the 438 day overguide scenario for the Roman GBTDS fields (M. T. Penny et al. 2019; G. Zasowski et al. 2025). The background is the Milky Way as seen by the Gaia Data Release 3 using mw-plot (H. W. Leung 2023).
Other Images in This Article
Show More
Copyright and Terms & Conditions
© 2025. The Author(s). Published by the American Astronomical Society.
Copyright ©
2026 Astronomy Image Explorer. All Rights Reserved.