Image Details
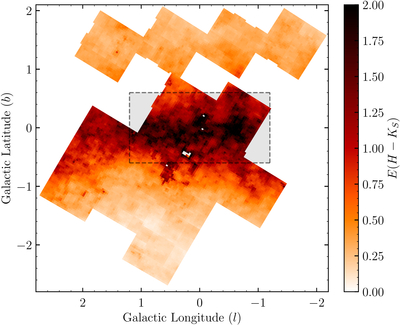
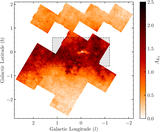
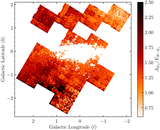
Caption: Figure 8.
﹩{2}^{{\prime} }\times {2}^{{\prime} }﹩ map of the E(H − KS) reddening of the Red Clump using H- and KS-band UKIRT photometry. The grayed region within ∣b∣ ≤ 0﹩\mathop{.}\limits^{\unicode{x000b0}}﹩6 and ∣l∣ ≤ 1﹩\mathop{.}\limits^{\unicode{x000b0}}﹩2 denotes where we declare lower limits on the extinction. The gray shading sits behind the map and does not affect the color of the pixels.
Other Images in This Article
Show More
Copyright and Terms & Conditions
© 2025. The Author(s). Published by the American Astronomical Society.
Copyright ©
2026 Astronomy Image Explorer. All Rights Reserved.