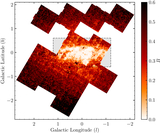
Image Details
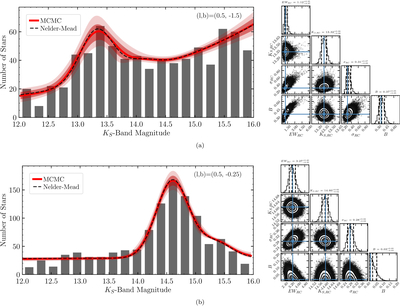
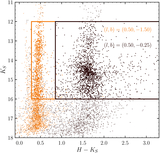
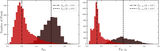
Caption: Figure 5.
Fit results for two sample fields of standard, ﹩{2}^{{\prime} }\times {2}^{{\prime} }﹩ size. We stress that we do not bin the data in our analysis and that binning is solely for visualization. Panel (a) is a high-latitude field that effectively characterizes the Red Clump and background giant stars. Panel (b) is a low-latitude field that suffers from crowding and completeness issues. The exponential shape of the background giant branch stars is missing, resulting in B pushing against the prior lower limit to account for the lack of stars. This field is an example where we only report a lower limit on the extinction. Corner plots of the MCMC sampling are provided in the right panels, with blue lines indicating values from the maximum likelihood estimation.
Other Images in This Article
Show More
Copyright and Terms & Conditions
© 2025. The Author(s). Published by the American Astronomical Society.