Image Details
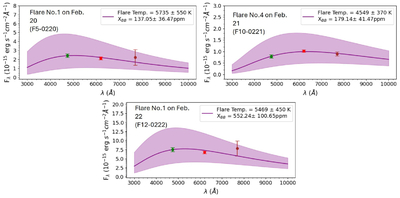
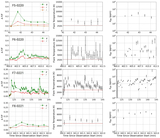
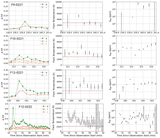
Caption: Figure 4.
Peak flare-only SEDs and best-fit blackbody models for three flares detected in the g, r, and i bands: F5-0220 (Flare No. 1 on February 20), F10-0221 (Flare No. 4 on February 21), and F12-0222 (Flare No. 1 on February 22). Colored data points represent the flare-only flux densities derived for each band (g band in green, r band in red, and i band in brown), and the solid purple lines show the corresponding blackbody fits, with shaded regions indicating 1σ uncertainties. The derived peak flare temperatures are Tfl,SED = 5700 ± 600 K, 4500 ± 400 K, and 5500 ± 500 K, respectively.
Other Images in This Article
Show More
Copyright and Terms & Conditions
© 2025. The Author(s). Published by the American Astronomical Society.
Copyright ©
2025 Astronomy Image Explorer. All Rights Reserved.