Image Details
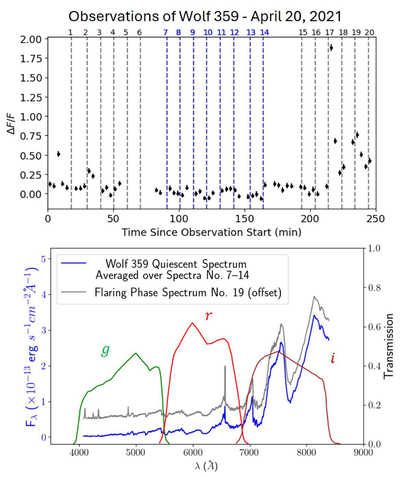
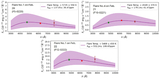
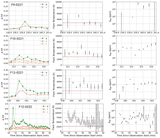
Caption: Figure 3.
Top: u-band light curve of Wolf 359 obtained on 2021 April 20, showing relative flux variability throughout the observation. Vertical dashed lines mark the midpoint of each spectroscopic exposure taken by using the Shelyak LISA low-resolution spectrograph (R ∼ 1000) on the Lulin 1 m telescope. Spectra numbered 7 through 14 (blue lines) were identified as taken during a flare-free interval and were used to construct the quiescent spectrum. Bottom: the quiescent spectrum of Wolf 359 (blue), obtained by averaging spectra Nos. 7–14. The spectrum in gray represents the spectrum No. 19 observed during the flaring phase and is offset by 0.5 units for better visual comparison. The transmission curves of the g (green), r (red), and i (brown) filters used by TRIPOL are also shown. This quiescent spectrum was used to calculate the star’s quiescent luminosities in the g, r, and i bands.
Other Images in This Article
Show More
Copyright and Terms & Conditions
© 2025. The Author(s). Published by the American Astronomical Society.