Image Details
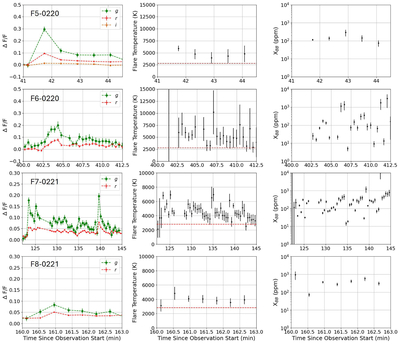
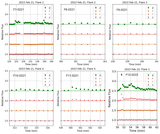
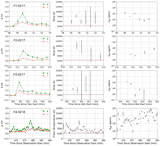
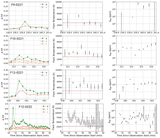
Caption: Figure 5.
Temporal evolution of flare temperature and filling factor (XBB) for all flares analyzed in this study. Each row corresponds to an individual flare event. The left panels display the flare light curves in the g (green) and r (red) bands, with the flare identification labeled accordingly. The middle panels illustrate the flare temperature as a function of time, derived from the g/r flux density ratio. The brown horizontal dashed line represents the effective temperature of Wolf 359, which is 2800 K. The right panels show the corresponding evolution of the filling factor (XBB) throughout the flare duration. For flares F5-0220, F10-0221, and F12-0222, which exhibited detectable amplitudes in the i band, the i-band light curves are also shown.
Other Images in This Article
Show More
Copyright and Terms & Conditions
© 2025. The Author(s). Published by the American Astronomical Society.