Image Details
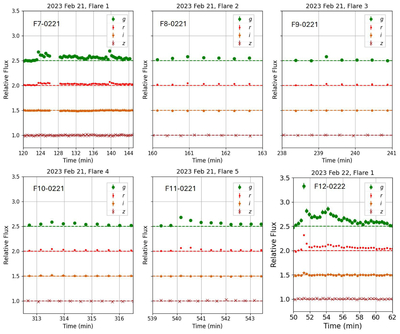
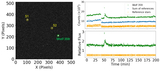
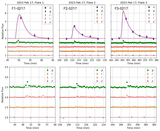
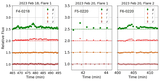
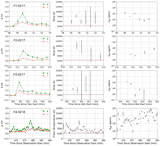
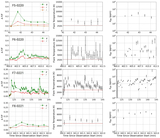
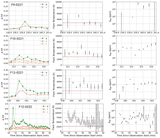
Caption: Figure 2.
Flares detected in Wolf 359 on 2023 February 17 in multiple photometric bands simultaneously. First row: light curves in the u, g, r, i, and z bands for each of the three detected flares. The purple solid curves represent synthetic flare profiles constructed to approximate the full flare variation in the u band based on the observed data points. These profiles were determined by using the flare profile model from M. Gryciuk et al. (2017), specifically their Equations (1) through (4). Second row: zoom-in profiles of the g-, r-, i-, and z-band light curves. Dashed horizontal lines indicate the quiescent flux levels in each band. The flares exhibit significant brightness enhancements in the u, g, and r bands, with much weaker or undetectable signals in the i and z bands. Third row: flares detected on 2023 February 18 and 20. Starting from February 18, observations were conducted only in the g, r, i, and z bands due to a malfunction of the u-band filter. Fourth and fifth rows: flares detected on 2023 February 21 and 22. In total, 12 flares were observed in Wolf 359 during our observation campaign.
Other Images in This Article
Show More
Copyright and Terms & Conditions
© 2025. The Author(s). Published by the American Astronomical Society.