Image Details
Caption: Figure 1.
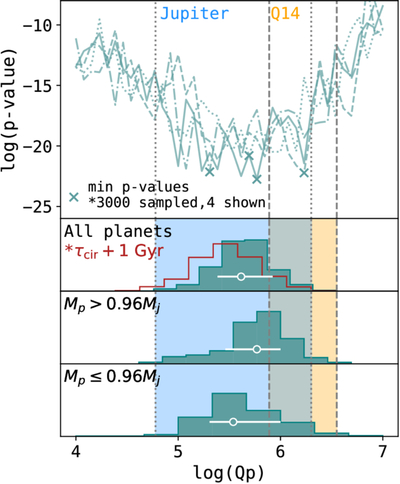
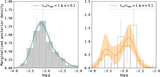
Top: p-values from KS tests with trial Qp comparing the eccentricity distributions of dynamically old and young planets across four representative iterations (out of 3000 total), distinguished by different line styles. In each curve, the minimum p-value among the trial Qp values in the same iteration is marked with an “x.” Bottom three panels: histograms of Qp corresponding to the locations of minimum p-values in each of the 3000 iterations, shown for (1) all planets, (2) planets above the median mass (Mp > 0.96 MJ), and (3) those below. In the first panel, we also overlay the case with a 3 Gyr offset applied to τcir, simulating the delay introduced by preceding processes such as eccentricity excitation. Dotted lines and blue shading indicate the constraints on QJ, while dashed lines and orange shading show constraints on Qp from S. N. Quinn et al. (2014).
Other Images in This Article
Copyright and Terms & Conditions
© 2025. The Author(s). Published by the American Astronomical Society.