Image Details
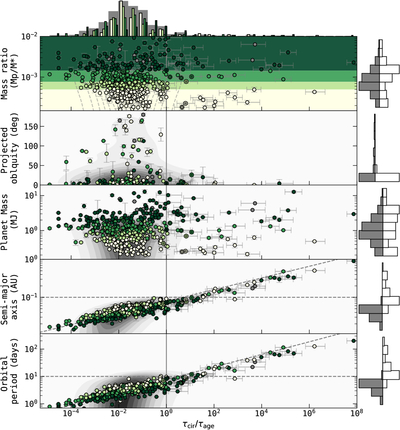
Caption: Figure 3.
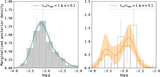
System parameters as a function of dynamical age, τcir/τage, for planets with e < 0.1 (including those on assumed circular orbits). The vertical line marks the threshold for disk migration candidates. Points are color-coded by mass ratio in quartiles, with four shades of green: darkest for the top 25% (75–100th percentile), medium-dark for 50–75th, medium-light for 25–50th, and lightest for 0–25th. Gray points denote systems with only upper limits on mass ratio. Double-filled circles indicate nearby companions, and circles filled with diamonds indicate systems with known binary companions. Gray and white histograms show distributions for dynamically old and young systems, respectively. For clarity, error bars on dynamical age are shown only for disk migration candidates. In the semimajor axis and orbital period panels, horizontal dashed lines mark a = 0.1 au and P = 10 days; diagonal lines trace expected dynamical age assuming median system values. The entire plot or individual panels can be regenerated with ident-dm (https://github.com/ykawai6581/ident_dm; doi:10.5281/zenodo.17100956).
Other Images in This Article
Copyright and Terms & Conditions
© 2025. The Author(s). Published by the American Astronomical Society.