Image Details
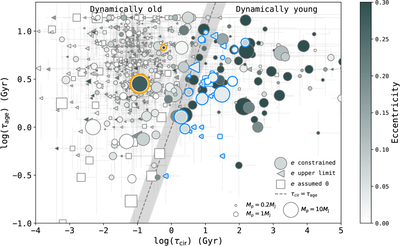
Caption: Figure 2.
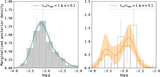
A recreation of Figure 4 in S. N. Quinn et al. (2014). The system age τage is plotted against the tidal circularization timescale τcir in logarithmic space, with color contours indicating orbital eccentricity. The dashed line marks where τcir = τage, based on Qp = 4.9 × 10⁵. The shaded region reflects the uncertainty in Qp. Marker size corresponds to planetary mass, and planets with only mass upper limits are excluded. Planets with fully constrained eccentricities are shown as circles, those with upper limits are triangles, and assumed circular orbits are indicated by squares. Dynamically old but eccentric outliers are highlighted in orange, while disk migration candidate hot Jupiters (a < 0.1 au) are highlighted in blue. We note that ﹩{({\tau }_{{\rm{cir}}}/{\tau }_{{\rm{age}}})}_{{\rm{median}}}\gt 1﹩ does not strictly imply τcir,median/τage,median > 1, and vice versa. This results in one planet to the left of the dashed line being highlighted in blue, and another to the right not being highlighted.
Other Images in This Article
Copyright and Terms & Conditions
© 2025. The Author(s). Published by the American Astronomical Society.