Image Details
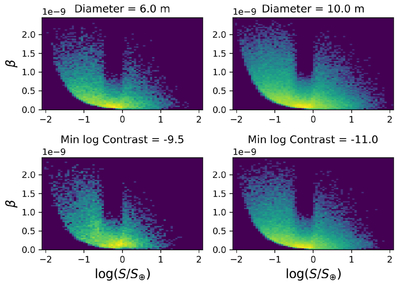
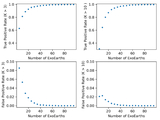
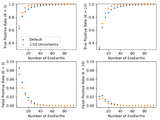
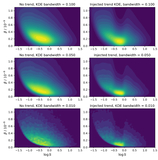
Caption: Figure 8.
Insensitivity of the survey distribution on telescope and coronagraph parameters. Each of these scenarios take the baseline case of the survey distribution shown in Figure 2 with D = 8 m and ﹩{\mathrm{log}}\,{C}_{\min }=-10.6﹩, varying either the diameter or minimum achievable contrast. Despite second-order differences between these scenarios, they largely have the same overall shape of their survey distribution.
Other Images in This Article
Copyright and Terms & Conditions
© 2025. The Author(s). Published by the American Astronomical Society.
Copyright ©
2025 Astronomy Image Explorer. All Rights Reserved.