Image Details
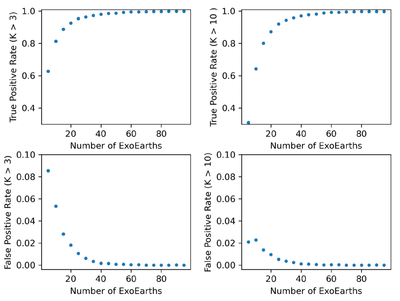
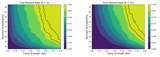
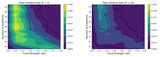
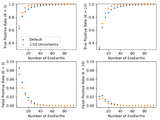
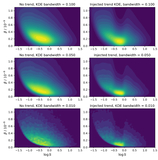
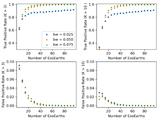
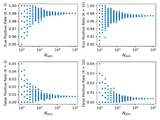
Caption: Figure 4.
Sample size of exoEarths required to detect an injected trend in albedo. Top panels represent the true-positive rate or statistical power as a function of the sample size of exoEarths, NEEC, for two threshold values of the Bayes factor, K. Bottom subplots show the false-positive rate as a function of sample size. For each point in these subplots an analysis similar to that in Figure 3 was performed using 10,000 simulations of planetary samples at that sample size. Simulations injected a strong albedo trend with ΔA = 0.4.
Other Images in This Article
Copyright and Terms & Conditions
© 2025. The Author(s). Published by the American Astronomical Society.
Copyright ©
2025 Astronomy Image Explorer. All Rights Reserved.