Image Details
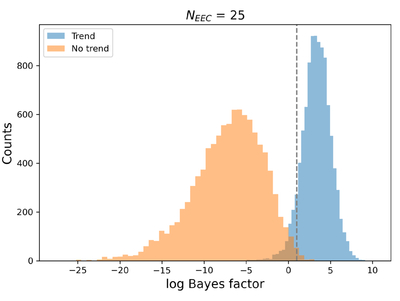
Caption: Figure 3.
Histogram of Bayes factors for random samples with 25 exoEarth candidates (EECs). Blue histogram represents points drawn from a distribution with a strong injected trend in albedo (ΔA = 0.4). Orange histogram represents points drawn from a distribution without any trend in albedo. The dashed vertical line represents the threshold for strong detection of a trend at a Bayes factor of K = 10. The region of the blue histogram to the right of this threshold represents the true-positive rate, or statistical power in favor of the albedo trend model. The region of the orange histogram to the right of the threshold represents the false-positive rate.
Other Images in This Article
Copyright and Terms & Conditions
© 2025. The Author(s). Published by the American Astronomical Society.